“What gets measured gets managed.” This old adage holds particularly true when it comes to building habits. Simply intending to be consistent often isn’t enough; we need clear feedback on our progress to stay motivated and make informed adjustments. While many apps let you check off habits, Strides stands out for its powerful focus on visualizing your journey. It transforms raw tracking data into insightful charts and graphs, making your progress tangible and providing the clarity needed for sustained habit development.
Strides is built on the principle that seeing your progress clearly is one of the most effective ways to maintain momentum. Whether you’re tracking good habits, bad habits, hitting target numbers, or working towards long-term goals, Strides offers flexible tracking methods and, more importantly, compelling ways to see how you’re doing over time. It moves beyond simple streaks to offer a dashboard view of your entire habit landscape, complete with trends, success rates, and projections.
This article focuses on how Strides empowers users to visualize success and leverage data for effective habit development. We will explore:
- The importance of visual feedback in motivation and habit formation.
- Strides’ four flexible tracker types (Habit, Target, Average, Project).
- The key visualization tools: dashboards, charts, and calendars.
- How data insights from Strides can inform adjustments to your strategy.
- Who can benefit most from Strides’ data-centric approach.
If you believe that seeing is believing, especially when it comes to personal progress, understanding how Strides visualizes success is key to unlocking its potential for your habit goals. Check our previous posts Mastering habits: AI tools for personal growth today and Building consistency: AI habit trackers for daily routines for a comprhensive guidance and enlightenment.
The power of seeing your progress
Why is visualization so crucial for habits?
- Motivation Boost: Seeing a streak grow on a calendar or a line chart trending upwards provides immediate positive reinforcement. It makes abstract goals feel concrete and progress feel real, fueling the desire to continue.
- Early Problem Detection: Charts can quickly reveal patterns you might otherwise miss. Is your consistency dipping on weekends? Is progress on a specific goal stalling? Visualizations act as an early warning system, allowing you to intervene before minor slips become major setbacks.
- Clarity on Long-Term Trends: While daily check-ins are important, seeing the bigger picture – your average success rate over a month, your progress towards a quarterly target – provides perspective and helps maintain focus on long-term objectives.
- Celebrating Small Wins: Visualizations highlight incremental progress, turning small daily actions into visible achievements. This helps combat discouragement when major breakthroughs seem far off.
- Data-Driven Decisions: Instead of relying on gut feeling, visual data allows you to make objective assessments about what’s working and what needs changing in your habit strategy.
Strides is designed specifically to leverage these benefits through its robust tracking and visualization capabilities.
Flexible tracking: the four Strides tracker types
Strides recognizes that not all goals are simple yes/no habits. It offers four distinct tracker types to accommodate different kinds of objectives:
- Habit Tracker: The classic tracker for yes/no goals performed on specific days (e.g., “Meditate Daily,” “Go to the Gym Mon/Wed/Fri”). Ideal for building consistent routines. Visualized with streaks, success rates, and calendar views.
- Target Tracker: For goals with a quantifiable target value to reach by a specific date (e.g., “Save $500 by June 30th,” “Lose 10 lbs by Christmas,” “Read 12 books this year”). Strides plots your progress against a target line, showing if you’re on track, ahead, or behind schedule.
- Average Tracker: Used for tracking averages over time (e.g., “Sleep average of 7 hours/night,” “Drink average of 8 glasses of water/day,” “Spend less than $50/day on average”). Helps monitor trends and maintain consistency in variable activities.
- Project Tracker (Milestones): Breaks down large projects into smaller milestones with due dates. Tracks the overall completion percentage as you check off each milestone. Useful for complex goals that aren’t daily habits but require consistent progress.
This flexibility allows you to track virtually any goal or habit within a single app, each with appropriate visualization methods.
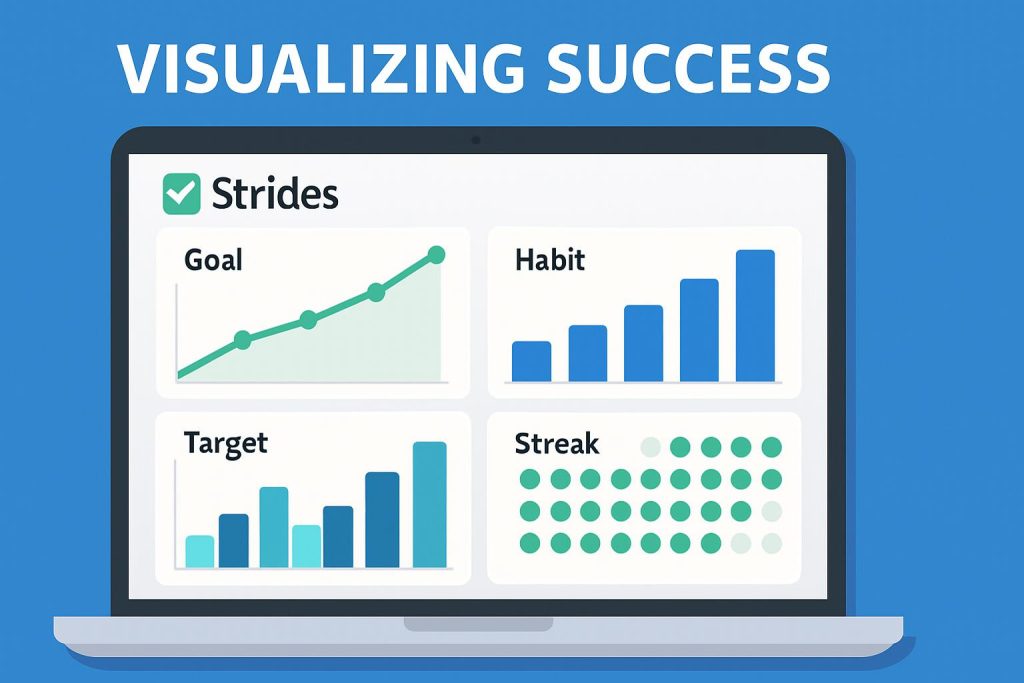
Visualizing success: Strides’ key tools
Where Strides truly excels is in presenting your tracked data:
- Dashboard Overview: The main dashboard provides an at-a-glance view of all your trackers, showing current streaks, progress bars, or status indicators. Color-coding (often green for on-track, red for off-track) gives immediate feedback.
- Detailed Charts: Each tracker has its own dedicated screen with detailed visualizations:
- Calendar View: Shows your history for yes/no habits, clearly highlighting streaks and missed days.
- Streak Chart: Visualizes the length of your current and best streaks for habits.
- Line Chart (Target/Average): Plots your progress over time against your goal line or tracks the rolling average.
- Bar Chart (History): Shows your logged values over time for Target or Average trackers.
- Success Rate: Calculates and displays your consistency percentage over various periods (week, month, year).
- Goal Pacing: The Target tracker explicitly shows whether you are on pace to meet your deadline, providing crucial feedback for time-sensitive goals.
- Filtering and Tagging: Organize trackers with tags (e.g., “Health,” “Work,” “Finance”) and filter your dashboard to focus on specific areas.
These tools transform simple data points into a rich visual narrative of your progress, making it easy to understand where you stand and where you’re headed.
From data to action: leveraging Strides insights
The visualizations in Strides aren’t just for show; they provide actionable insights:
- Identify Weak Points: Consistently red calendar days or a dipping average chart clearly signal areas needing more attention or a change in strategy.
- Adjust Goals: If the Target tracker shows you’re consistently far ahead or behind schedule, you can adjust the goal or deadline to be more realistic.
- Reinforce What Works: Seeing strong streaks or positive trends reinforces the effectiveness of your current approach, encouraging you to keep going.
- Stay Accountable: The clear visual representation of your commitments makes it harder to ignore slip-ups and encourages getting back on track.
By regularly reviewing your Strides dashboard and charts, you move from passively tracking to actively managing your habit development based on objective data.
Who benefits most from Strides?
Strides’ data-centric and visual approach is particularly beneficial for:
- Data-Driven Individuals: Anyone who appreciates metrics, charts, and analyzing trends will find Strides highly satisfying.
- Goal-Oriented Achievers: The focus on tracking progress towards specific targets (numerical, deadlines) aligns well with achievement-focused personalities.
- Users Tracking Diverse Goals: The four flexible tracker types make it suitable for managing a wide range of habits and objectives beyond simple yes/no routines.
- Visual Learners: People who understand and are motivated by visual representations of information will appreciate the emphasis on charts and graphs.
- Those Needing Clear Feedback: If ambiguity demotivates you, Strides’ clear pacing indicators and success rates provide unambiguous feedback.
While it lacks the overt gamification of Habitica or the deep workflow integration of Routine, Strides excels in its core mission: providing flexible tracking and powerful visualizations to help you understand, manage, and achieve your goals through consistent effort.
Success in habit development often hinges on clear feedback and sustained motivation. Strides provides both through its powerful focus on visualizing progress. By offering flexible tracking methods and translating your efforts into insightful charts, calendars, and dashboards, it makes your journey tangible and keeps you informed every step of the way. If you’re ready to truly see your progress and use data to build better habits, Strides offers a compelling and visually rich platform.